
Growing metrics with design thinking
Role: Senior Product Manager
Stakeholders: Product, Customer Success, Marketing
Tools used: Superset (Analytics), Google Analytics
For any organisation, a funnel is a reliable indicator to determine the health of your user journey. At Seenit, a particular funnel the “Uploader” was crucial to the success of customer projects on the Seenit platform. In short, the user journey requires a user to upload a media file (image or video) in response to some instructions (a “brief”) on a page. Without uploads, or even with very few uploads, customers could not produce a full edited video with other user uploads answering the brief.
The problem 🤔
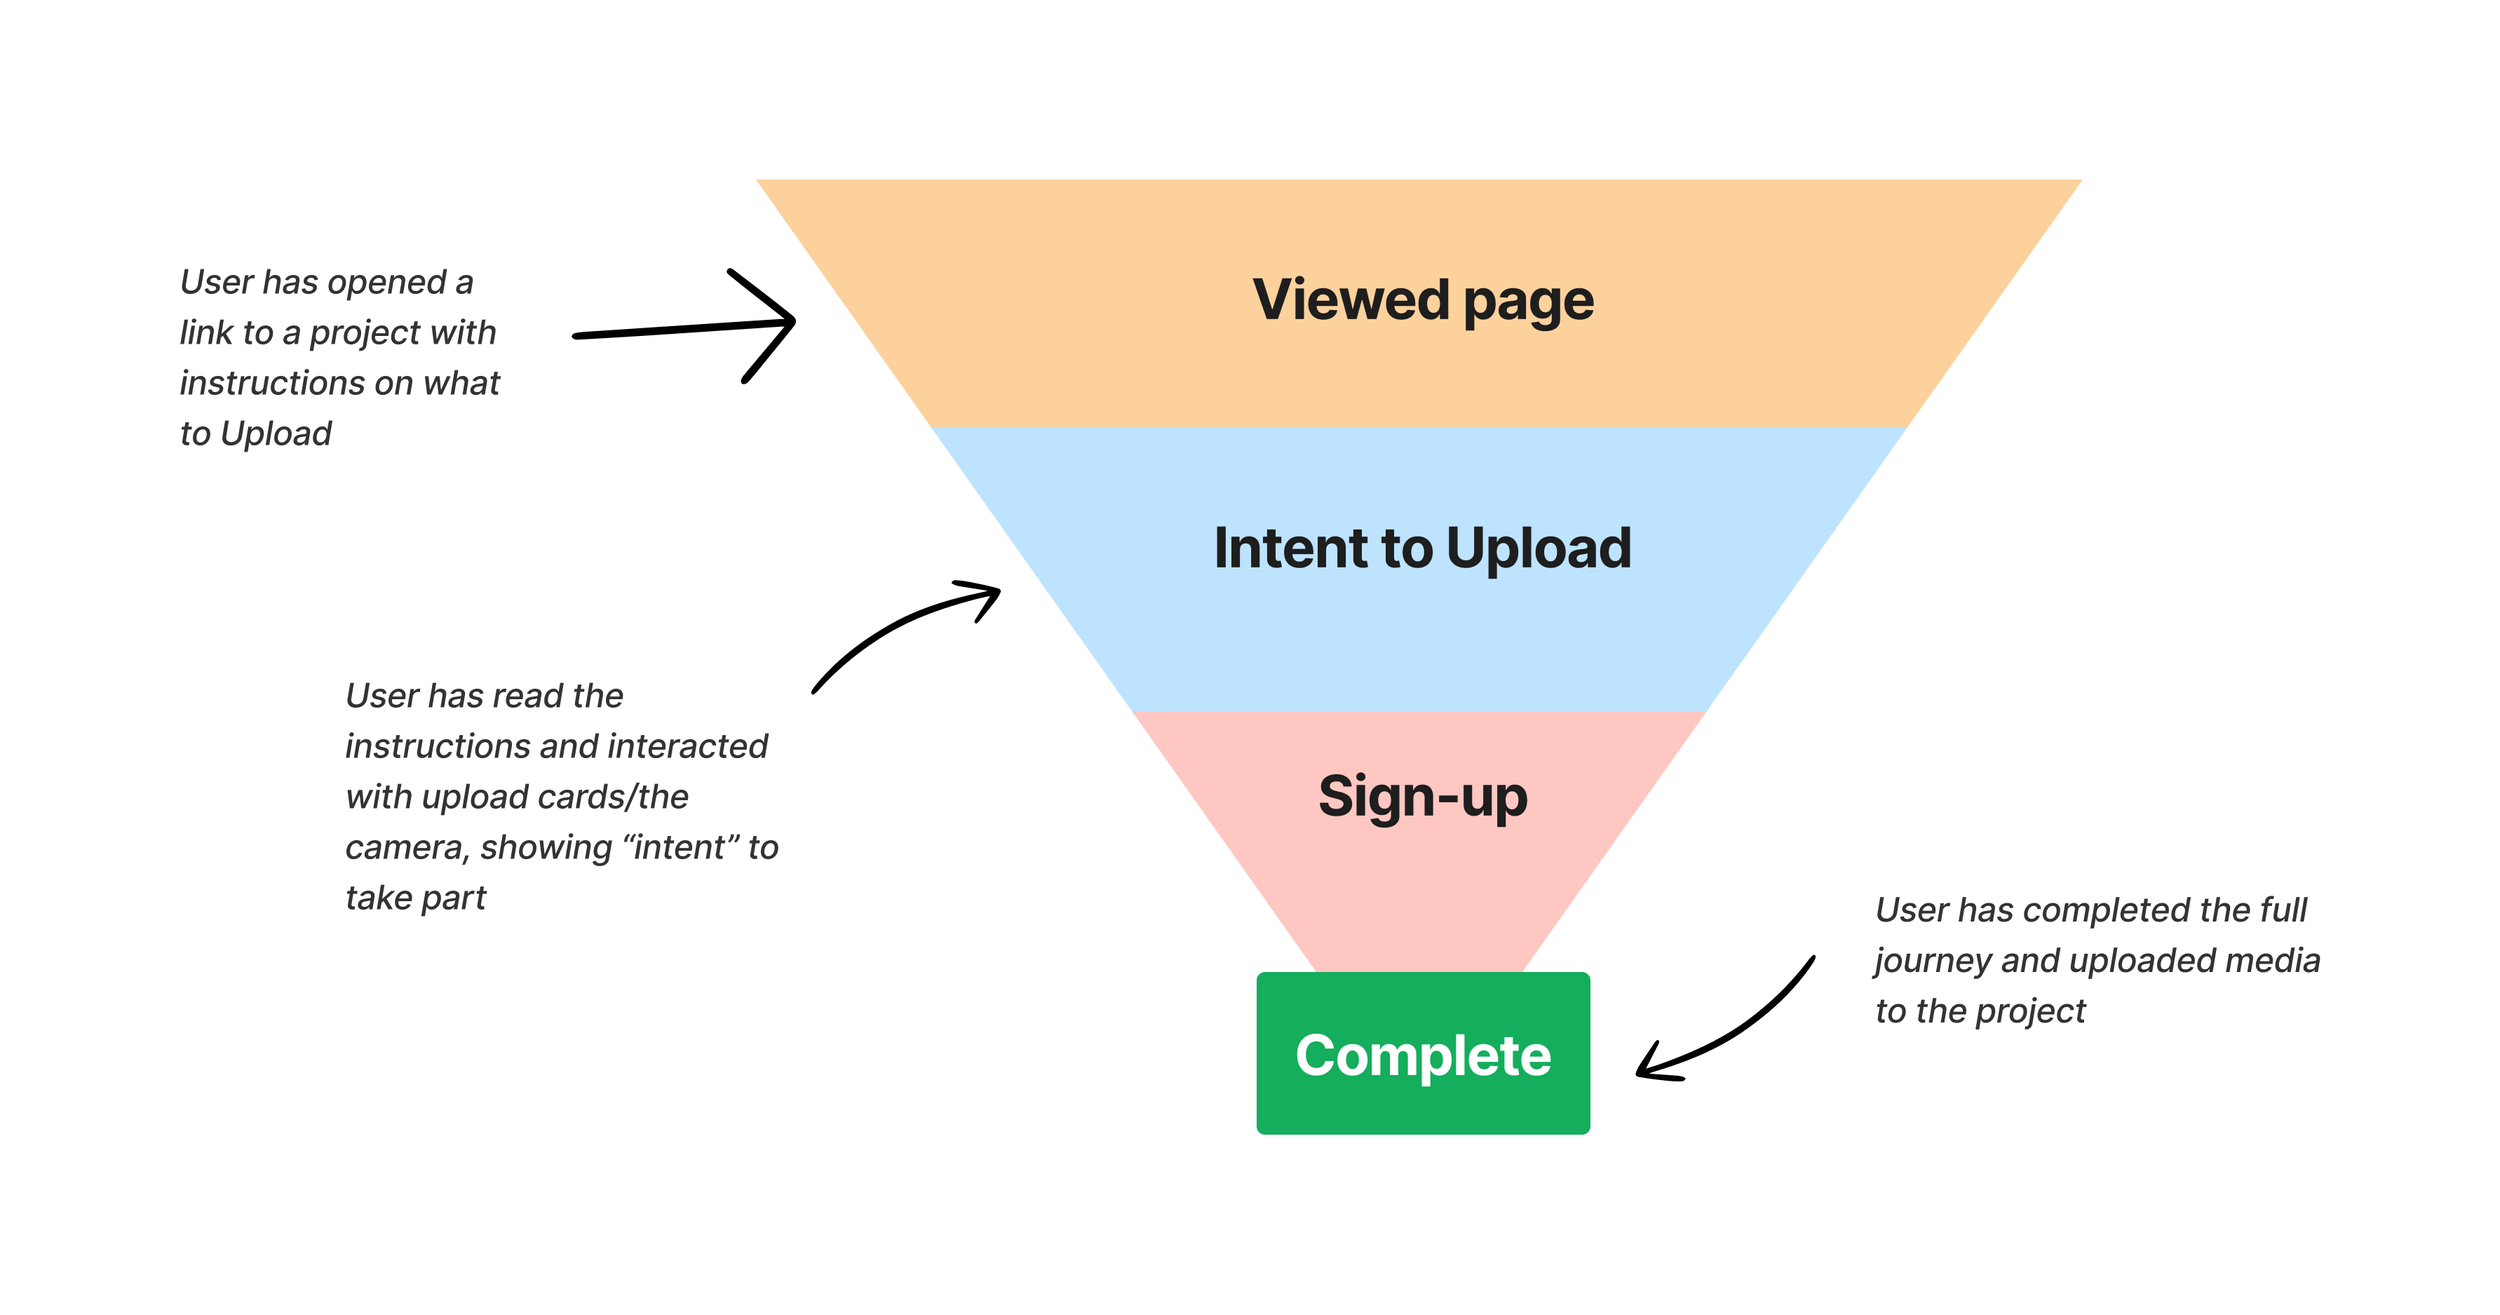
Funnel stages on the “Uploader”
When reviewing the metrics, I noticed that the completion ratio was really low; only 15% of all users (within a period of 3 months) ever completed their upload. On a deeper dive, these were the results from each stage of the funnel:
Intent to upload
40%
Sign-up
20%
Complete
15%
The drop-off from funnel entry (viewing the “uploader” page) to showing upload intent was around 60%. I wanted to tackle this number first to increase the volume of users who could potentially complete the journey.
Alongside this, I observed some recordings and viewed some customer projects to see if there were any indicators as to why users didn’t show any intent to upload. The major finding was that it was impossible to compare projects! Specifically, briefs followed no consistent format; some customers wrote long, verbose briefs, others barely any information at all.
So what did we do? 🔧
My main aims for the project were the following:
Find ways to drive user intent on page
Unify the way customers create their briefs, minimising any variability to support future analysis
When reviewing customer feedback around the uploading experience, there was one consistent trend… the ability to build projects using templates. These templates would be pre-written briefs that could be re-used. This presented an opportunity to develop a template that would unify how briefs were created. But how to structure this in a way that encourages engagement?
Introducing 4mat
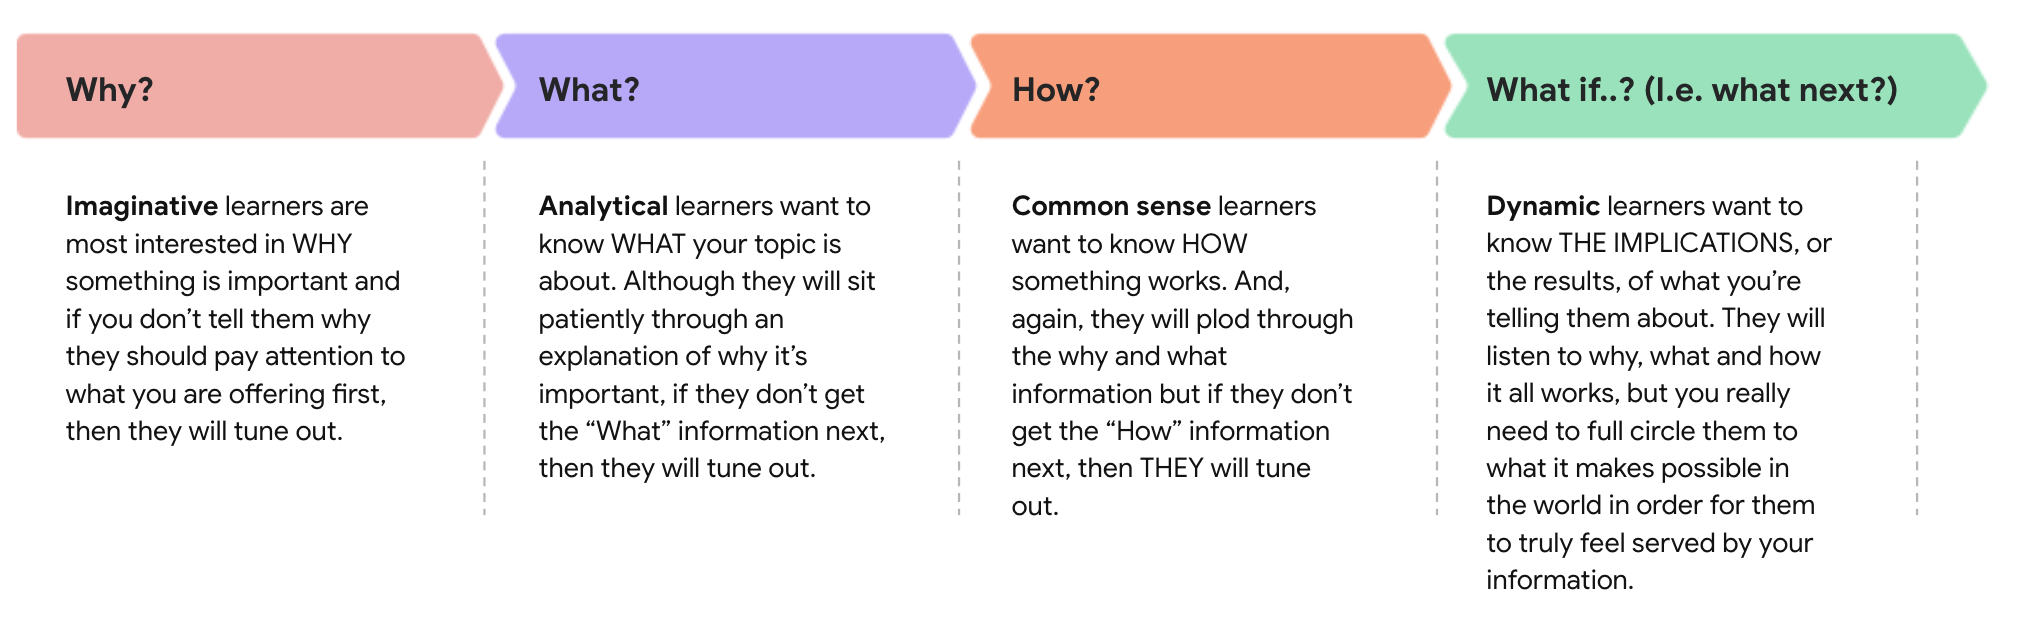
4mat is an educational tool researched by Harvard researcher Dr. Bernice McCarthy to support various methods of learning. https://crossmancommunications.com/4mat/
From my experience, I have implemented 4mat in multiple situations (see this case study for more) to great effect. Applying this thinking to how our users interact with the uploader gave a more structured approach to our thinking for templates. Below is how I grouped key uploader pains/feedback to the 4mat thinking.
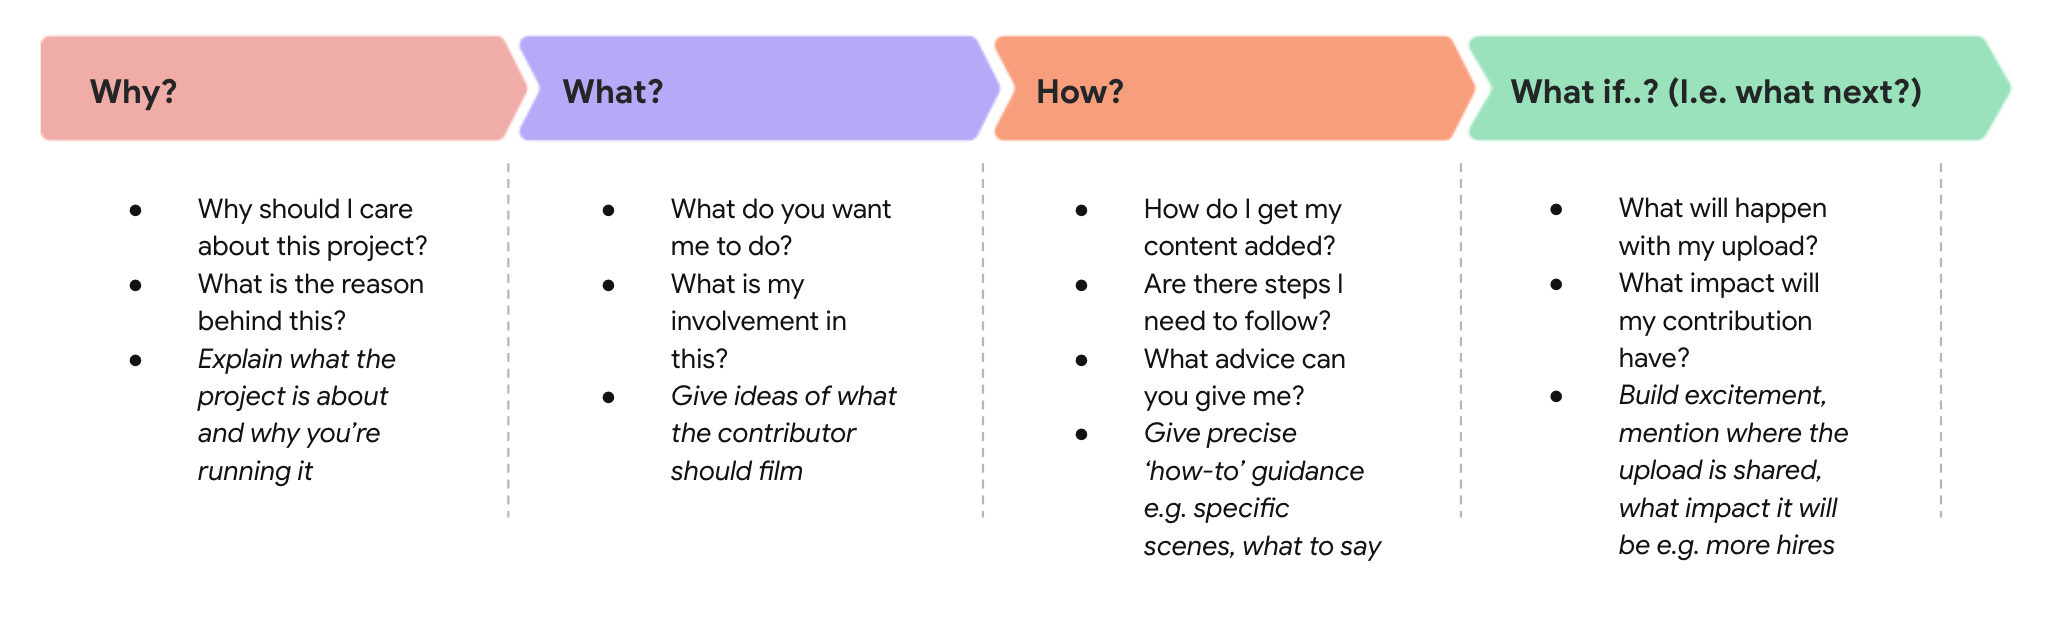
Common questions from Uploaders which I grouped in to the four learning styles.
A project squad was formed to discuss the proposed structure, along with goal setting and stakeholder buy-in to build some initial templates to test with. For the project, the hypothesis we agreed to was:
“Projects using templates will have a higher Intent % than those not using templates.”
Below is a before and after example output of a project brief using 4mat. In short, it’s about project information in to the 4 sections, to encourage different learner types to upload, reducing the cognitive load when viewing the page for the first time.
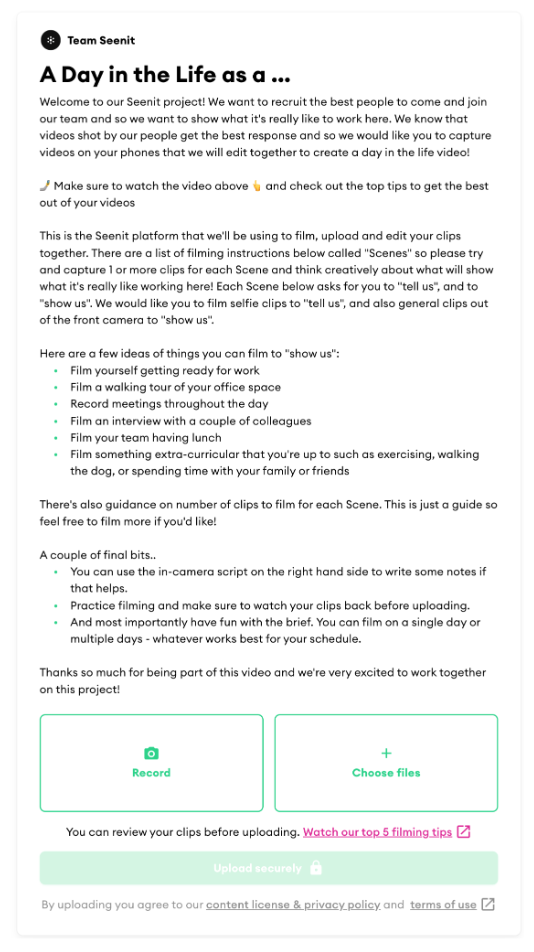
An example of an unformatted project. Information is sporadic and disorganised.
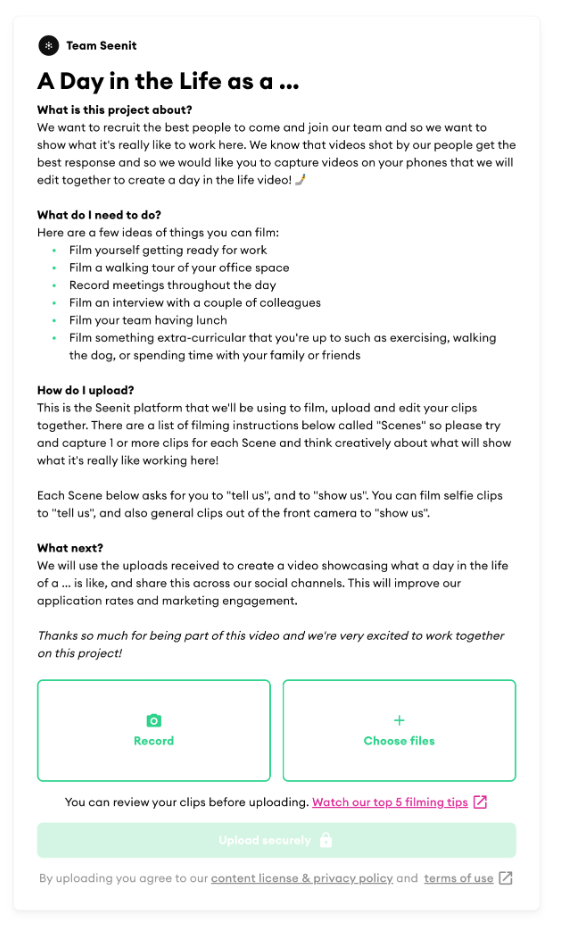
Apply the 4mat principle to the same “brief”.
Did it work? 🔍
Collectively the team worked on the new templates, 5 to begin with, around differing topics. These templates were launched to users via the ‘create project’ journey, in which they were given the option to use the template.
From my side, I created a dashboard with the funnel mentioned earlier, along with a table displaying the customers, projects and associated template used.
I decided to measure all projects across a month, to then compare projects that use templates, to those without. Within a month I was confident we’d have a large enough sample size. Here’s how it turned out:
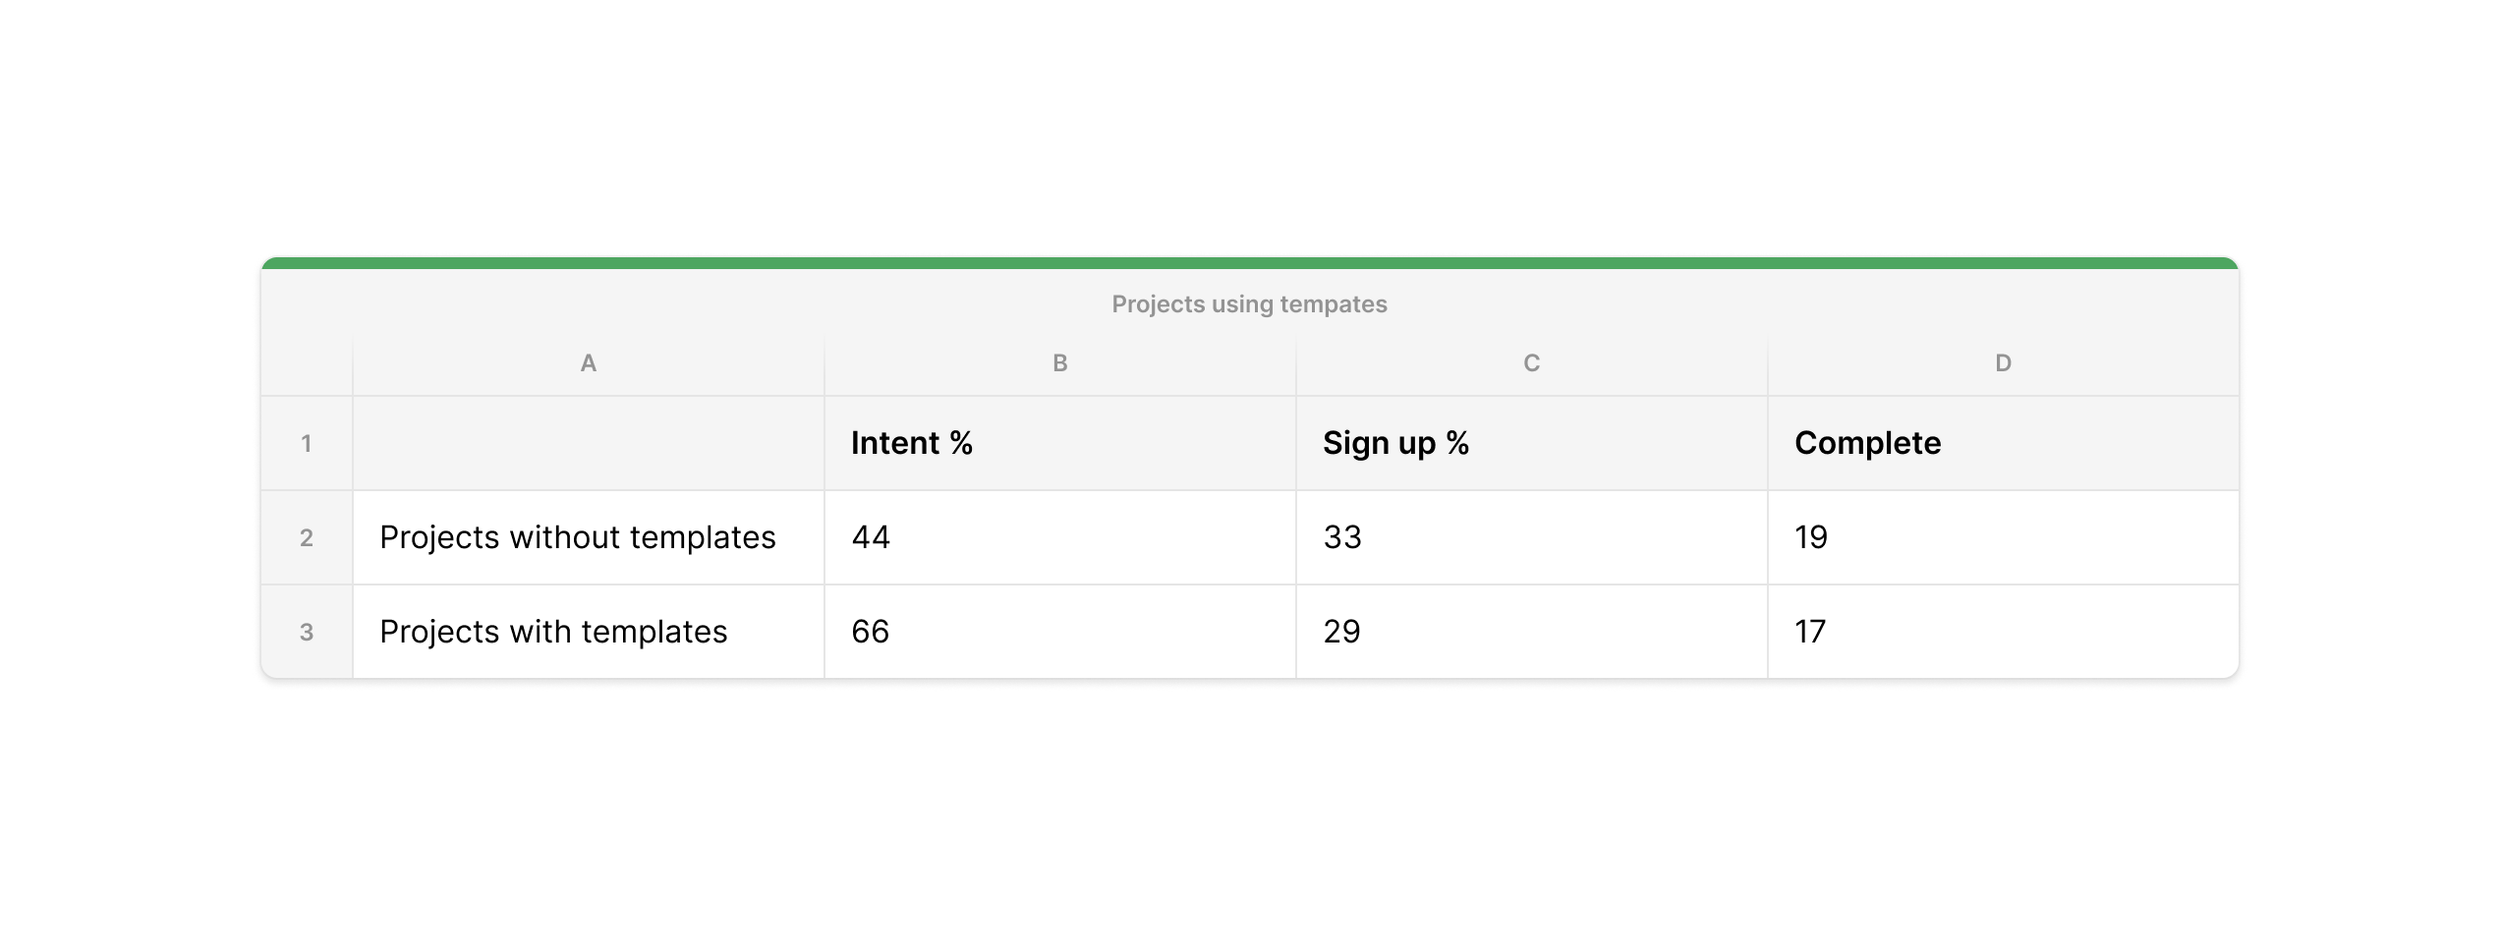
Table with average % completion on funnel stages
As the table shows, projects using templates in this period had around 66% of users show intent to upload, compared to 44% on projects not using templates.
This was a huge success for us in terms of our hypothesis of supporting intent. Equally, we found that the new templates had a lagging effect on the number of projects created in total. Users found it quicker to use the templates instead of building projects themselves, thus having more time to create more.
However, this project highlighted to us the drop-off at sign-up. It would appear that this is where the most friction for users occurs, and what should be looked at next.
gOT feEDBACK?
Please drop me a message with any questions or comments. Cheers!